With data bottlenecks and silos continuing to frustrate supply chains around the world, we discuss how solid data foundations can lead to success.
INTRODUCTION
From the COVID-19 pandemic to the highest inflation rates in decades and geopolitical instability to slowed economic growth, global supply chains have been pushed to the brink for over two years and will undoubtedly continue to cause disruptions.
These unprecedented challenges have revealed that most supply chains lack the capabilities to quickly identify, measure, monitor, and report potential risks.
The ability to accurately monitor operations and quickly react to unexpected events has never been more urgent, pushing 70% of companies to accelerate their digital road maps. Implementing a digital strategy does, however, come with challenges.
To illustrate the specific pain points that supply chains face, we’ll review the most common data issues and create a list of data opportunities for maintaining a resilient supply chain. Understanding the challenges and possible solutions will allow you to build a successful digital roadmap and unlock the value of your data.
In this article, we will break down:
- The supply chain’s data issues and challenges.
- A three-step process to overcome supply chain bottlenecks.
- Three inspiring stories on creating a data-driven supply chain.
Ready? Let’s dive in.
WHAT DATA CHALLENGES EXIST IN THE SUPPLY CHAIN?
The amount of data created by consumers doubles every two years, whereas only 1% of it gets harnessed. Despite recognizing the power of data, most companies and their supply chains still struggle with these common issues:
- Lack of holistic visibility
With supply departments being the first to feel the impact of unpredictable economic shifts, gaining supply chain visibility has become one of the top priorities for many organizations. Despite the importance of end-to-end visibility over operations, forecasting demand, and limiting disruptions, only six percent of businesses believe they’ve achieved full visibility of their supply chain operations. Why?
The increased pace of globalization and numerous inter-dependencies across a network have made modern supply chains more complex than ever before. While supply departments gather enormous amounts of data from multiple locations, they struggle with bringing it all together. Many significant data sets, such as point-of-sale data, inventory data, or production volumes data, get trapped in departmental silos, making it impossible to spot issues before they become serious problems. What’s more, a majority of the data exists in its native or raw form. Examples of such unstructured data may include data in logs, images, documents, invoices, or emails. Unlike structured data, such as names, addresses, or geolocation, unstructured data offers poor visibility.
- Dubious and incomplete data
Because data comes from many different sources, organizations face the challenge of poorly integrated ERPs and ingested data. Inaccurate, incomplete, or out-of-date data causes a bias within the supply department information set. In fact, only eight percent of companies trust the data coming from their supply chains.
What’s more, manual data entry remains a common approach. Almost half of supply chain managers still rely mostly on manual processes, meaning redundant workloads and significantly slower times to market. Manual data entry increases the number of errors, raising the tide of mistrust around data, all of which creates a vicious circle.
- Legislation and compliance
The ever-changing legal requirements mandate that companies assess their suppliers for human rights and environmental protections. To ensure compliance, organizations must audit their entire supply chain.
Without due diligence and transparent measures, companies cannot identify and prioritize potential risks, which would prevent relevant information from being shared with their stakeholders. Any delay in adopting these measures could result in a brand’s reputational damage.
- Sustainable sourcing and traceability
According to NielsenIQ, nearly half of U.S. consumers would change their buying habits to reduce their environmental impact. Evolving consumer expectations are driving significant changes in the supply chain, bringing sustainable sourcing and traceability to the fore.
For this reason, more and more companies are integrating social, ethical, and environmental performance factors into the list of criteria for their new suppliers. In addition, supply departments are incorporating technology solutions to close information gaps and provide updates for all product development stages.
A THREE-STEP PROCESS TO OVERCOME THE TOP SUPPLY CHAIN BOTTLENECKS AND DRIVE VALUE FROM DATA
Build more resilient operations by identifying and fixing the bottlenecks, which requires a 360 view of your entire supply chain. Because achieving end-to-end visibility over your operations is a complex and extensive process, we suggest breaking it down into the three steps described below. This way, you’ll ensure that your supply chain is better prepared for the upcoming slowdowns:
Step 1: Integrate your applications
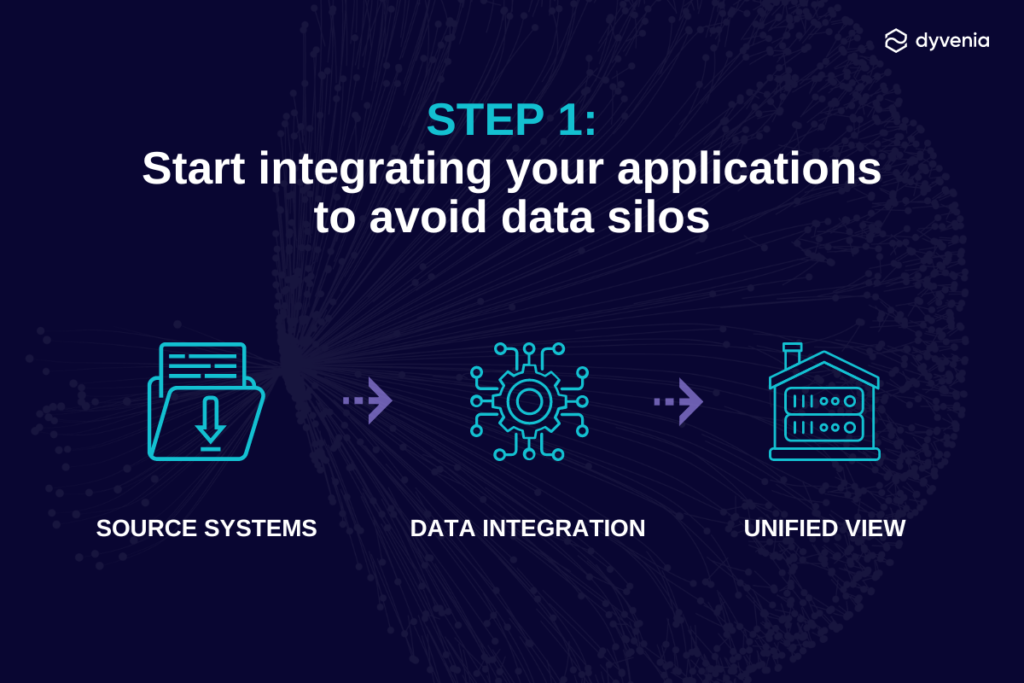
Supply, finance, sales, marketing, HR, and other departments collect their own data in their own locations. This is how data silos arise naturally, and hinder the company from obtaining full visibility. To break down siloed data, data integration is necessary.
Data integration is the process of combining all the data coming from different sources into a single location to provide users with a unified view. Based on their data pipelines needs, companies usually use one of two data integration approaches: ETL (extract, transform, load) or ELT (extract, load, transform).
Both ETL and ELT processes include the following three steps:
- Extract: Data extraction works similarly in both approaches – raw data is extracted from the original data source.
- Load: In ETL, data is loaded into a staging area for transformation, while ELT delivers it directly into a target system.
- Transform: ETL performs data transformation within a staging area outside the data warehouse. ELT eliminates the need for data staging and allows loading and transforming data in parallel, making the integration process significantly faster.
Which solution is better?
“Choosing the best solution for data integration depends on the company’s needs and its characteristics. Both the ETL and ELT processes can help improve the supply chain’s visibility by integrating data silos and removing bottlenecks. If speed and flexibility are your number one priorities, ELT might be the best option, as it enables faster implementation and supports both structured and unstructured data. ETL is best suited for smaller data sets that require less frequent updating.” – Mateusz Paździor, dyvenia’s Data Engineering Team Lead.
Step 2: Utilize near real-time data to react faster
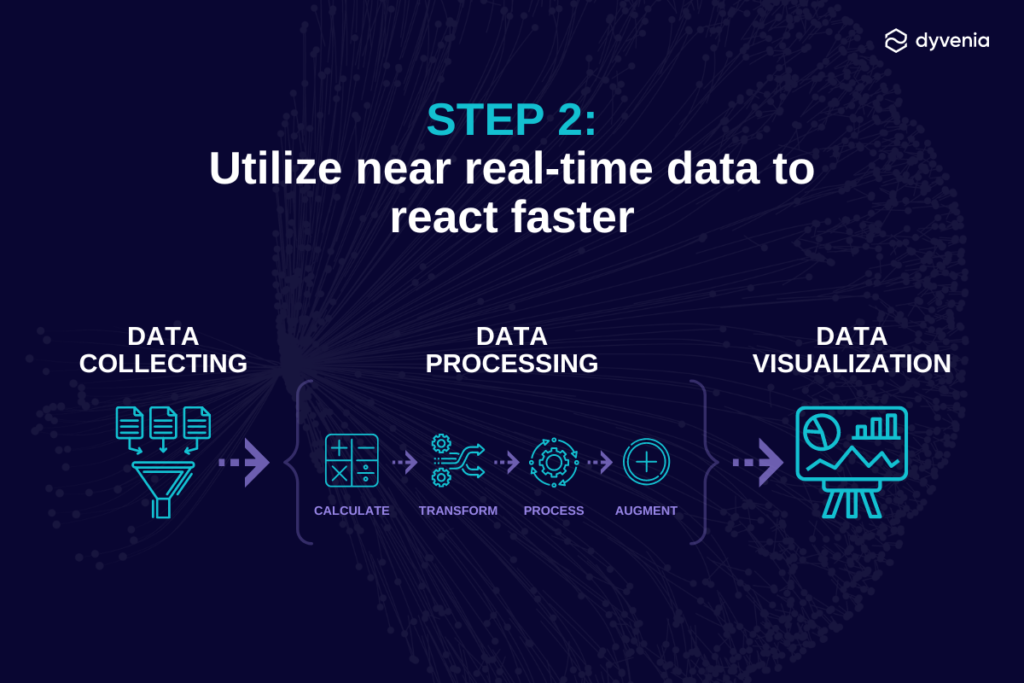
Once your data is integrated, it’s time to implement a near real-time analytics solution. Because supply chains are exposed to many vulnerabilities, near real-time analytics has become a necessity, allowing supply managers to create more accurate forecasts, provide better planning capacity, and drive business decision-making without delay.
Near real-time analytics is the process of preparing and analyzing data on a continual basis. It follows these steps:
- Data collecting: Live streaming data is collected and stored in a database.
- Data processing: The data is processed as it flows, converting raw facts or data into meaningful information.
- Data visualization: Visualizations of the processed data are drawn in the reporting interface to update the near real-time dashboard.
“When it comes to dashboard and report updates, the frequency of refreshes depends on clients’ needs and purposes. In supply departments, where speed is as precious as gold, easy-to-understand data visualizations can be generated in seconds, or even milliseconds, enabling managers to identify risks and opportunities much faster,” – Rafał Ziemianek, dyvenia’s Data Engineering Junior Team Lead.
Step 3: Implement data solutions to enhance sustainability
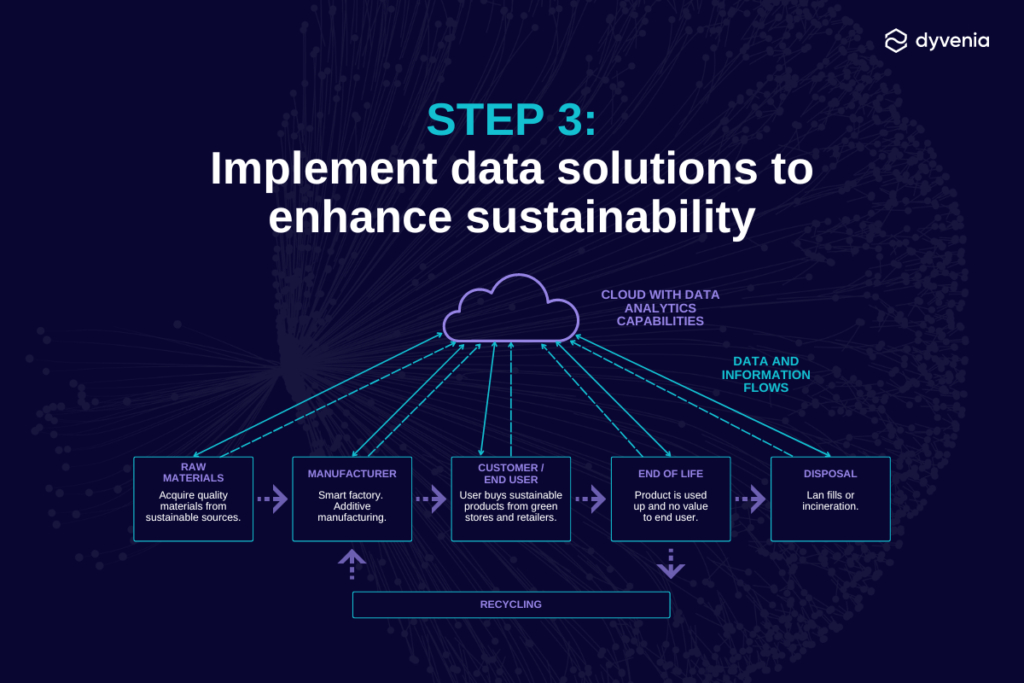
Integrating data silos and acquiring real-time data are two important milestones along the road to obtaining end-to-end visibility over operations and achieving your company’s sustainability goals. Companies can incorporate data analytics solutions for the most efficient and effective sustainability initiatives, including:
- transportation optimization
- waste or by-products reuse
- inventory minimization
- carbon accounting
- pollution prevention
- product stewardship
Of these, carbon accounting is a key tool in climate change mitigation.
“Carbon accounting or greenhouse gases (GHG) accounting measures the impact that the volume of GHG emissions has on climate change. [It] is first and foremost a data engineering challenge as it requires diligent data collection from various sources. Without a proper data collection process, pretty visualization dashboards or advanced models about carbon emissions are useless.” – dyvenia’s CEO, Alessio Civitillo, from our article on how companies can provide carbon accounting data accurately to reach their goal of net-zero emissions.
THREE INSPIRING SUCCESS STORIES
To inspire you to succeed, here are three real-life examples of companies that used the power of data to turn their ambitious goals into reality.
1. UPS uses AI to save about 100 million miles and 10 million gallons of fuel per year
In 2012, UPS deployed the On-Road Integrated Optimization and Navigation platform (ORION) that plans and optimizes the routes taken by their drivers. First, the system collects logistical data, such as past route performance, package deliveries, and pickup times. Based on that data, AI algorithms and deep learning create the most efficient route for deliveries and pickups, while reducing miles driven, fuel consumed, and carbon emissions.
2. Pfizer provides a real-time virtual map of its supply chain to accelerate patient impact and deliver medicine faster
Introduced in 2015, a formal initiative called Highly Orchestrated Supply Network (HOSuN) fuses Pfizer’s global physical supply chain with a global information supply chain, enabling complete visibility into products’ location and status at all times. In addition, HOSuN allows Pfizer to perform predictive analytics that anticipate future demand patterns throughout the globe. Because Pfizer’s products are highly complex and often take nine to 15 months to manufacture, identifying demand is of inestimable value.
3. Patagonia ensures complete transparency and reporting by placing its supply chain in the public eye
The 2021 Fashion Transparency Index rated Patagonia’s transparency as 51-60%, higher than most fashion companies. Knowing that 97% of its emissions are caused by its supply chain, Patagonia has integrated data analytics into its quest for sustainability. Moreover, its commitment to sharing data about where its products are made and sourced scored a 61-70% rating. Currently, Patagonia is improving its initiatives and accelerating data transformation to reach its goal of becoming carbon neutral by 2025.
CONCLUSION
Taking the first steps toward building a data-driven supply chain can be tricky. When you start with a solid data foundation, you’ll be able to generate valuable insights in seconds which can open up opportunities and enhance your supply chain’s sustainability. A well-planned digital strategy offers countless inspiring paths to achieving your business goals. UPS, Pfizer, and Patagonia have shown the way: are you ready to boost your supply chain and succeed?
Author
-

Wiktoria is a Communication & Marketing Specialist with extensive experience in social media, content creation, copywriting, design, and research. Her degree in Management and professional NGO background has provided her with a comprehensive understanding of various aspects of business and developed a strong focus on people’s needs. Wiktoria’s hidden agenda is to make social media a better place to grow.
View all posts

