Introduction
Storytelling is an essential human skill. Stories help us make sense of and put into perspective the increasingly complicated digital world around us. Even though Gartner predicts that by 2025 data stories will be the most widespread way of consuming analytics, using data to tell a story is still an emerging concept.
Valeria’s experience confirms that.
Back in my wide eyed, excel monkey years I was working for the Spanish market. My client trusted me (my team) to make sure their customers were billed on time and then paid, but also, that the whole process with a million manual steps ran smoothly and with constant improvements. We were encouraged to come up with ideas, but somehow my proposals based on real life data, statistics on our problems and actual cost were not getting me anywhere. I needed to get to them, but my shiny barcharts and progress graphs weren’t hitting the spot.
I struggled a lot.
But then I started creating and strengthening relationships, asked a thousand questions, shadowed multiple people’s work and tried my best to find out what really kept my client up at night. I realized lots of data were getting archived, never used, and that the connections were just wrong.
Based on these realizations, I prepared graphs and visualizations, and adjusted the way I exposed my ideas. And I got my first successes!
Just like Valeria in her early years, we often forget that we need to tell stories. So what should we do to bring data insights closer to our customer? What is data storytelling and what makes a good data story? What are the skills we need and where should we start?
WHAT IS DATA STORYTELLING?
Data Storytelling is the ability to tell a story with data and to personalize the data seen based on the audience. To do this, you need to be mindful of the following:
- Context
- Visuals
- Focus
- Storytelling structure
THE IMPORTANCE OF CONTEXT
Before you start working on your story, ask yourself the following questions:
- Who is your audience?
- What do they need to know?
- What are they (we) trying to do?
- How do we get there?
Build a clear understanding of who you are communicating with, what you need them to know or do, how you will communicate to them, and what data you have to back up your case. Employ concepts like the 3-minute story, the Big Idea, and storyboarding to articulate your story and plan the desired content and flow.
Valeria’s example:
Who: My audience are the finance directors of a manufacturing company who approved and started a new pricing method on one of the product lines.
What: This new method has been live for six months, and we want to expand it to 10 more product lines.
How: Illustrate the success of the first product line and the way it benefited the organization, how it could benefit us if we scaled it up.
Tips
- Be careful not to overwhelm your audience. After undertaking an entire analysis, it can be tempting to want to show your audience everything, to evidence of all the work you did and the robustness of the analysis. Resist this urge. You are making your audience reopen all of the oysters! Concentrate on the pearls, just the information your audience needs to know.
- Read the book The Mom Test. It makes no sense to build a story for an audience who you don’t understand. Your story might be amazing, but it won’t resonate with your audience if you haven’t done the empathy work first. What biases does the audience have? What data is available? What are the risks that they want me to address? What background information is relevant or essential?
- Read the book Storytelling with Data, where you will find most of the theoretical information, examples, and visuals to help you with the actual writing.
VISUALS
Consider these two questions:
- How much control do I have over the way the audience assimilates information?
- What level of detail is needed?
With a live presentation, you (the presenter) are in full control. You determine what the audience sees and when they see it. You can respond to visual cues to speed up, slow down, or go into a particular point in more or less detail. Not all of the detail needs to be directly in the communication (the presentation or slide deck), because you, the subject matter expert, are there to answer any questions that arise over the course of the presentation.
In writing, you have less control, because the audience controls the way they consume the information.
Types of visuals
You can typically meet your needs using one of the visuals below. Be sure that the chart illustrates the relationship you want to convey.
- When highlighting a number or two, simple text is best.
- Line charts are usually best for continuous data.
- Bar charts work well for categorical data and must have a zero baseline.
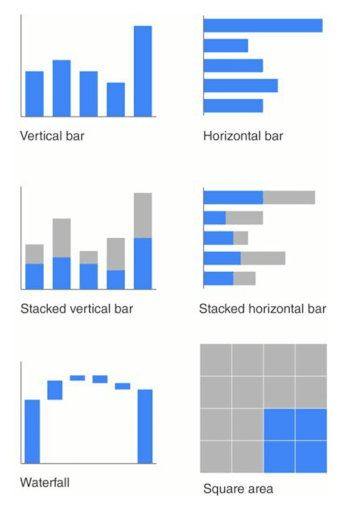
Important! Do not use:
- Pies and donuts because they have proportion issues.
- 3D charts, because, according to Valeria: they are unnecessary distractions and also not proportionate, and no, it’s not cute.
- Secondary y-axes due to difficulty of visual interpretation.
Tips
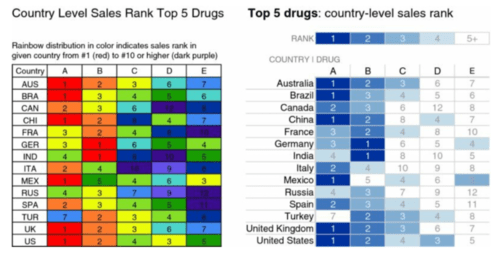
- Don’t make your audience angry! If you make things hard to understand, they will be frustrated at the visual and at you.
- If you make your audience do mind calculations or squint their eyes: you have lost them.
- Avoid clutter. Valeria here suggests using the “Marie Kondo” principle. Ask yourself: »Does the content spark joy?« Every piece of information takes away a bit of their attention. Does it deserve a piece of my audience’s attention?

Valeria’s example:
Think about hotel rooms, we feel comfortable when we are surrounded by few things, plain and usually white colors. Makes our brains go ‘this is clean, you can relax’. We associate simple with elegance, luxury. When you declutter your visuals, you make your audience feel like they’re entering the top floor suite.
Leverage the Gestalt principles to understand how people see and identify candidates for elimination. Use contrast strategically. Employ alignment of elements and maintain white space to help make the interpretation of your visuals a comfortable experience for your audience.
FOCUS
Employ the power of preattentive attributes like color, size, and position to signal what’s important. Use these strategic attributes to draw attention to where you want your audience to look, and guide your audience through your visual. Evaluate the effectiveness of preattentive attributes in your visual by applying the “where are your eyes drawn?” test. Very powerful when used sparingly and strategically.
Tips
- Don’t use too many colors. You can end up creating a Christmas tree.
- Same goes for highlighting: you can make other things harder to see. Too much formatting can have the same effect.
Stories work like Magic:
- Keep it simple
- Edit ruthlessly
- Be authentic
- Don’t communicate to yourself
Think of a bonfire party. Make your story so good that the audience will focus on that and not on the dude playing guitar, the stars or the hypnotizing fire.
When we tell a story we are taking on responsibility, because the audience is agreeing to go on a journey with us and we need to make it worth their while.
The story is for them, so make sure you are understood.
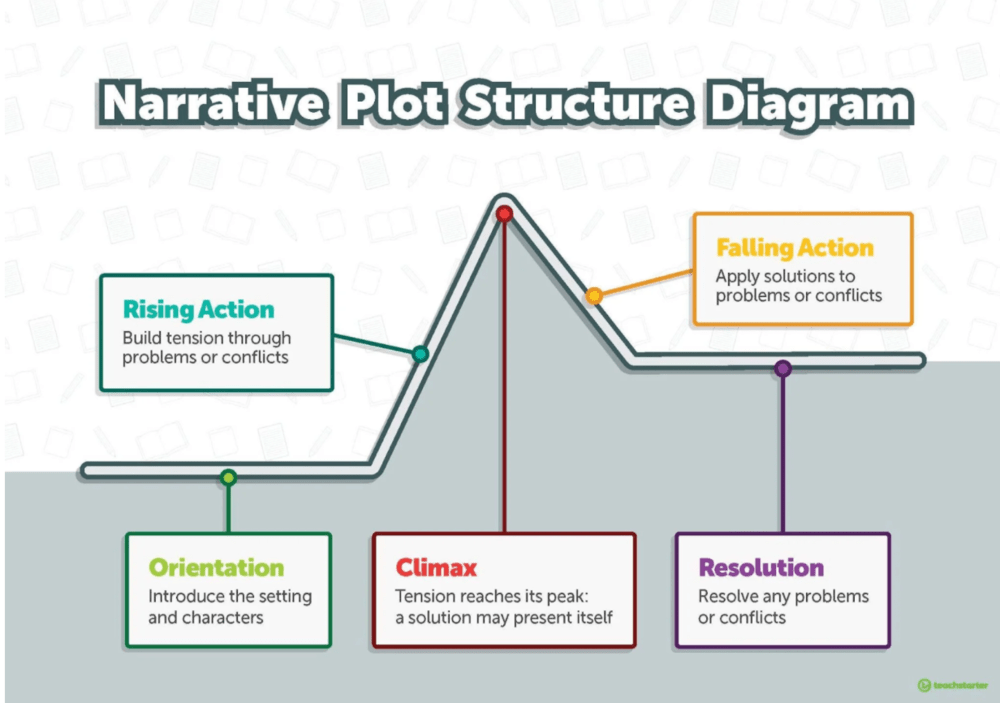
STORYTELLING STRUCTURE
Constructing a story
Craft a story with clear beginning (plot), middle (twists and climax/’ah moment’), and resolution/end (call to action). Consider the order and manner of your narrative. Use the power of repetition to help your stories stick.
Tips
- KIS-Keep it short: use short, engaging words.
- Edit: Have the guts to cut!
- Make it sound like yourself. There is no need to fake it.
- Leverage conflict and tension to grab and maintain your audience’s attention.
- Keep your audience on the edge of their seat.
- You don’t have to (AND SHOULDN’T) do this on your own.
- Tell stories to each other within the team, test your ideas. Question: where is your attention going? What message is sticking with you right now?. Look for the key roles in the people around you: story editor (someone who writes better than you), researcher (someone who is familiar with the topic and/or the data), constructive critic(someone who knows you or your audience very well and it’s not afraid to tell you the truth).
- Find examples to use some storytelling techniques and start applying right away, testing first in a friendly environment.
- Practice, Practice, Practice.
- Double bonus: by practicing on the rest of your team, they will also improve their storytelling skills!!
CONCLUSION
Once I realized I was onto something with these new skills, I stuffed up my CV with my VBA, and my SAP and my UiPath and somehow got an interview for a job with none of those skills, as a Junior Data Analyst.
I’d like to say that I told my story and charmed my way into getting the job, but it was in fact the other way around, the Lead of Data Analytics got me instead. He didn’t ask me what I wanted to be in five years or about Excel functions. He showed me practical examples and he told me about their journey: how his current team of three started as just him delivering numbers here and there, reporting… and how they had a vision of bringing all the data of a big company into one place and actually using it, helping their colleagues make better decisions. And it wasn’t only a vision, there was all this data and all these facts along the way. I was sold.
The ability to tell engaging data stories is one of the most powerful tools you can use to help you land a good job, get amazing clients and charm your next talented hire.
To practice storytelling, start with your own story. It’s a fun way to practice and who can be more of an expert on your life than you? You have the data, test it on your friends in a relaxed environment. As for the context: Ask yourself WHAT, WHO, HOW? Choose the right Visual (remember, no clutter) and bring the attention where it needs to be. Make your audience comfortable and make your story easy to follow. Structure your story and add the ups and downs. Remember that the story is about your audience and that you don’t have to do it alone.